Move Beyond Dashboards. Start Engineering Decisions.
Moving BI from reporting toward decision intelligence and operational action.
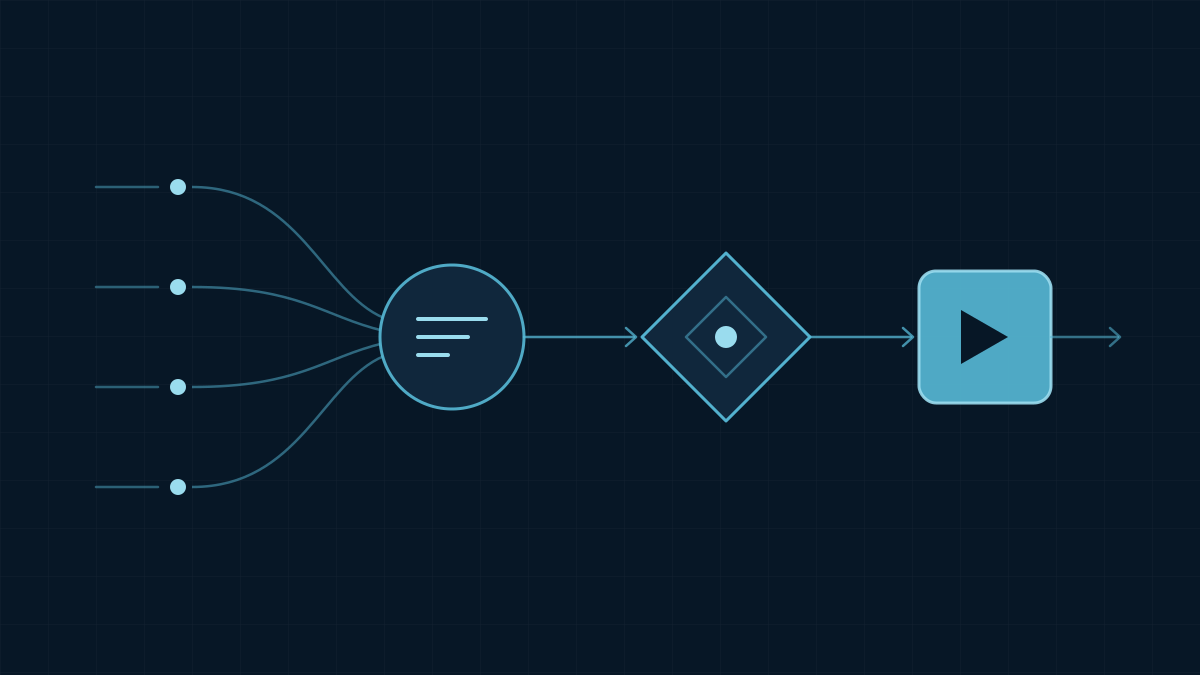
For more than two decades, business intelligence has helped organisations answer an important question:
What happened?
Revenue declined. Service levels changed. Costs increased. A region performed differently. A customer segment behaved unexpectedly.
Dashboards made this information visible.
That was a significant improvement over manually assembled spreadsheets and reports distributed days or weeks after the underlying events.
But visibility is no longer the hardest problem.
The harder question is:
What should happen next?
A manager sees that receivables are deteriorating. Which accounts should be contacted first?
A service leader sees SLA performance declining. Which cases are actually at risk, why, and what intervention is most likely to help?
An operations team sees an asset behaving abnormally. Is it noise, an emerging failure or something requiring immediate attention?
A sales leader sees conversion falling. Which customers require action, which action, and who should take it?
A dashboard can tell someone that a problem exists.
It rarely completes the decision.
That is why the next evolution of BI is not simply better visualisation.
It is decision engineering.
Reporting was designed for people to interpret
Traditional BI has largely followed a predictable pattern.
Operational systems generate data.
That data is extracted and transformed.
Metrics are calculated.
A semantic model gives the numbers meaning.
A dashboard presents the information.
Then a person interprets what they see.
They compare.
Investigate.
Discuss.
Download.
Email.
Open another system.
Eventually, someone takes an action.
For many organisations, the analytical system ends precisely where the operational work begins.
That boundary is increasingly artificial.
If the organisation already knows that a particular combination of conditions requires investigation, escalation or action, why should the analytical environment simply colour a chart red and wait?
The future of BI is not a dashboard with more AI embedded in it.
It is a system capable of connecting information, decisions and action.
The metric is not the decision
One of the biggest design mistakes in BI is treating a KPI as though it were the business requirement.
Consider:
Days Sales Outstanding
It is an important measure.
But nobody’s job is simply to observe DSO.
The actual business questions are closer to:
- Which outstanding accounts are deteriorating?
- Which customers represent meaningful financial exposure?
- Which invoices are disputed rather than simply overdue?
- Which accounts should be contacted today?
- Which require escalation?
- What is the likely cash-flow impact if nothing changes?
The KPI provides context.
The decision creates value.
This distinction sounds obvious, but it fundamentally changes how analytics should be designed.
Instead of beginning with:
What should the dashboard show?
start with:
What decision are we trying to improve?
Then work backwards.
The metric provides context. The decision creates value.
Decision intelligence begins with the decision
A well-engineered analytical capability should understand more than metrics.
It should understand the decision context around them.
- Who makes the decision?
- What information do they require?
- How frequently is the decision made?
- What conditions trigger it?
- What rules constrain it?
- What alternatives exist?
- What happens after the decision?
- What constitutes an exception?
- How will we know whether the decision worked?
This creates a different architecture.
The analytical model is no longer simply producing information for consumption.
It becomes part of a decision loop:
- Observe
- Understand
- Decide
- Act
- Learn
Once that loop is explicit, analytics, workflow automation and AI can begin to work together.
From dashboard to decision system
Imagine a finance team managing receivables.
A conventional BI implementation may provide:
aged debt, overdue balances, customer exposure, payment history, ageing buckets and trend analysis.
Useful information.
But imagine taking the capability one step further.
The system identifies accounts whose payment behaviour is deteriorating.
It distinguishes normal lateness from unusual behaviour.
It combines customer value, outstanding balance, dispute information and prior interactions.
It prioritises accounts requiring attention.
For routine cases, it prepares an appropriate follow-up action.
For higher-risk accounts, it recommends escalation.
The finance team still retains control.
But instead of beginning every morning by interpreting several dashboard pages, they begin with:
These are the 17 accounts requiring attention today, and this is why.
That is not a better dashboard.
It is a better operating capability.
Traditional BI
- Data
- Metric
- Dashboard
- Human interpretation
Decision-oriented BI
- Data
- Context
- Recommendation
- Action
- Outcome
SMEs have an advantage here
Large organisations often have hundreds of dashboards, multiple BI platforms, heavily customised ERP environments and complex ownership structures.
An SME may have fewer systems and fewer analytical resources—but this can actually make decision engineering easier.
There are fewer layers between information and action.
A finance manager may sit close to operations.
A customer-service leader may understand the complete service process.
The same team may own both reporting and operational improvement.
This makes it possible to begin with a small number of high-value decisions rather than launching a large enterprise analytics transformation.
The objective should not be to create a sophisticated BI estate for its own sake.
It should be to create a small number of analytical capabilities that materially improve how the organisation operates.
The semantic layer becomes more important, not less
The arrival of generative AI has led some organisations to assume that traditional BI disciplines will become less important.
The opposite is likely to happen.
If a person reads a dashboard containing inconsistent numbers, they may challenge them.
If an AI agent uses those numbers to make recommendations or initiate actions, inconsistent definitions become considerably more dangerous.
An intelligent system must understand what concepts such as customer, active customer, revenue, margin, service case, priority, overdue, risk, inventory, and utilisation actually mean.
It needs trusted relationships between those concepts.
It needs to know which source is authoritative.
It needs context.
This makes semantic modelling, data quality, ownership and governance even more valuable.
AI does not remove the need for trusted BI foundations.
It increases it.
The dashboard should become an interface to action
Dashboards themselves are not disappearing.
They remain extremely useful.
But their role should evolve.
Instead of being passive destinations where users consume information, they can become interfaces into operational decisions.
A service-performance dashboard might expose cases requiring intervention, likely SLA breaches, recommended actions, responsible owners, and outstanding exceptions.
The user should be able to investigate the evidence and, where appropriate, initiate the next step without beginning an entirely separate process.
This can be as simple as assign, approve, escalate, contact, create task, or request investigation.
In more mature environments, the analytical layer can trigger these actions automatically within defined rules.
The important principle is:
insight should be located as close to action as practical.
Insight should be located as close to action as practical.
AI changes the decision layer
This is where AI becomes genuinely useful.
Traditional analytics works exceptionally well where rules and measures are structured.
AI extends what we can do where context is less structured.
It can summarise customer interactions.
Interpret free text.
Analyse documents.
Identify recurring themes.
Explain anomalies.
Generate recommended actions.
Retrieve relevant organisational knowledge.
Assess information against policies.
Prepare communications.
Increasingly, AI agents can coordinate several of these activities.
But AI should not replace the decision architecture.
It should operate within it.
A good decision system knows which information is trusted, which rules are deterministic, which decisions can be automated and which require human judgement.
AI fills the spaces where interpretation, reasoning or unstructured information is required.
Human judgement remains part of the architecture
The objective is not to remove people from every decision.
It is to remove unnecessary effort from decisions.
Consider three levels.
At the first level, analytics tells the user what is happening.
At the second, the system recommends what should happen.
At the third, the system performs routine actions and asks people to handle exceptions.
The appropriate level depends on consequence, confidence and reversibility.
Sending a reminder about an overdue invoice may eventually be highly automated.
Changing a customer’s credit limit may require approval.
Rejecting an important customer request may require stronger human oversight.
Good decision engineering explicitly designs these boundaries.
It does not simply add AI and hope that users determine where trust should begin and end.
A practical decision architecture
For most SMEs, sophisticated decision intelligence does not require an enormous technology estate.
The architecture can remain relatively simple.
- Operational systems remain the systems of record.
- A trusted data layer integrates the information required for analytical decisions.
- Business definitions and semantic models establish common meaning.
- Analytics detects conditions and patterns.
- AI interprets context where appropriate.
- Rules define deterministic boundaries.
- Workflow orchestrates what happens next.
- Human approvals manage exceptions and high-consequence actions.
- Monitoring captures outcomes.
That final element is particularly important.
A decision architecture should not end with:
Action executed.
It should also capture:
What happened afterwards?
Without this feedback, the organisation cannot learn whether the recommendation or action was actually useful.
Move from KPIs to decision products
A useful way to modernise the BI portfolio is to stop thinking exclusively in terms of reports and begin thinking in terms of decision products.
A decision product is a reusable analytical capability designed around a recurring business decision.
For example:
- 01
Receivables Prioritisation
Rather than a collection of finance charts, it answers: Which accounts require action now?
- 02
Service Intervention
Which customer cases are likely to breach agreed service levels?
- 03
Inventory Exception Management
Which items require replenishment, investigation or reallocation?
- 04
Customer Retention
Which customers show meaningful indicators of disengagement and what action is appropriate?
- 05
Operational Risk
Which events fall outside expected behaviour and require investigation?
Each decision product can still contain dashboards.
But the dashboard becomes one interface into something broader.
Don’t automate a bad decision process
There is an important warning.
Before engineering intelligence into a process, make sure the process deserves to be automated.
Some organisations have reporting processes built around historical system constraints.
People collect data manually because systems never integrated.
Approvals exist because nobody trusts the information.
Reports contain dozens of metrics because nobody agreed which decisions matter.
Automating this environment can make a poor process faster without making it better.
Decision engineering should therefore begin with simplification.
- What decision actually needs to be made?
- What information genuinely matters?
- Which steps exist only because of limitations in the current process?
- Which controls are required?
- Which are historical?
The objective is not:
automate what people currently do.
It is:
design the best operating decision we can, then determine how technology should support it.
Measure the quality of decisions
Traditional BI programs frequently measure success using technical adoption: dashboard views, monthly active users, report consumption, refresh times, or number of reports retired.
These measures have value.
But they do not necessarily tell us whether the business improved.
Decision-oriented analytics creates much better measures.
- How quickly was an exception resolved?
- How many recommendations were accepted?
- How often were recommendations overridden?
- Did interventions reduce service failures?
- Did collections improve?
- Did forecasting error decline?
- Did the number of unnecessary escalations decrease?
- Did customer outcomes improve?
This is particularly important for AI-enabled decisions.
Every acceptance, rejection, override and outcome becomes feedback.
The organisation gradually develops evidence about where automation works and where human judgement remains essential.
The destination is better decisions, not better dashboards.
The BI team itself needs to evolve
This shift also changes the role of analytics teams.
A traditional BI team may be organised around data extraction, modelling, report development, dashboard delivery, and support.
Those capabilities remain important.
But decision engineering requires closer interaction with business-process design, data engineering, application integration, workflow automation, AI engineering, governance, and operational teams.
The analytical team begins to ask different questions.
Not:
Which chart would communicate this KPI?
But:
What needs to happen when this KPI crosses the threshold?
Not:
Which filters do users want?
But:
Which information changes the decision?
Not:
How many users viewed the report?
But:
Did the organisation make a better decision?
That is a substantial change in mindset.
A pragmatic progression for SMEs
There is no need to replace the existing BI environment.
Start with one dashboard people already rely on.
Ask:
What decisions are people making after looking at it?
Choose one recurring decision that consumes significant effort or has meaningful business consequence.
Then progressively move through five stages:
- Visibility
- Explanation
- Recommendation
- Action
- Learning
At Visibility, the organisation can see what happened.
At Explanation, it can understand why.
At Recommendation, analytics or AI suggests what should happen next.
At Action, workflow and automation execute appropriate decisions.
At Learning, outcomes improve future recommendations.
This is a much more valuable maturity model than simply adding more visualisation features.
Build strategically, even when starting small
As with AI engineering, the first decision capability should not become another isolated solution.
If the first use case requires trusted customer data, establish customer information in a form that can be reused.
If it requires workflow integration, create an integration pattern that future decisions can adopt.
If it introduces AI recommendations, create a reusable evaluation and monitoring pattern.
If it requires human approval, establish a consistent approach to exception handling.
The immediate project delivers value.
But each implementation also strengthens the enterprise foundation.
Over time, the marginal effort required to engineer the next intelligent decision decreases.
That is where investment begins to compound.
The opportunity is bigger than BI modernisation
Many organisations are currently discussing BI modernisation, cloud analytics, semantic models, Fabric, AI copilots and agentic AI as though these were separate initiatives.
They are increasingly becoming parts of the same architectural question:
How does trusted enterprise information become better operational action?
- Modern data platforms make information available.
- Semantic models make it understandable.
- Analytics identifies patterns.
- AI adds interpretation and reasoning.
- Workflow connects insight to execution.
- Governance establishes boundaries.
- Observability tells us whether it worked.
The opportunity is not merely to modernise reporting.
It is to engineer a decision layer across the organisation.
The destination is better decisions, not better dashboards
Dashboards have created enormous value.
They will continue to.
But the next step is to stop treating information delivery as the end of the analytical journey.
A dashboard should be able to tell us what deserves attention.
A decision system should help determine why.
An intelligent system should recommend what to do.
And, where confidence and controls allow it, an operational system should be able to act.
That progression is where analytics begins to change the operating model rather than simply describe it.
So perhaps the question is no longer:
What should our next dashboard show?
It is:
Which decisions should our data help us make better—and how close can we responsibly bring intelligence to the action?
That is the transition from business intelligence to decision intelligence.
And it is where the next generation of BI will create its greatest value.
- BI & Advanced Analytics
- Decision Intelligence
- Semantic Model
- Intelligent Automation
- Data Quality
- SME